
Clean Air Metals PEA Delivers C$219.4 M pre-tax NPV, 39% IRR for the Thunder Bay North Project
THUNDER BAY, ON / ACCESS Newswire / October 9, 2025 / Clean Air Metals Inc. ("Clean Air Metals" or the "Company") (TSXV:AIR)(FRA:CKU)(OTCQB:CLRMF) is pleased to announce results from an independent Preliminary Economic Assessment (PEA) and updated resource that was completed for its Thunder Bay PGE-Cu-Ni Project near Thunder Bay, Ontario, Canada. The PEA outlines an 11-year mine life (+ 2 years of pre-production activities) producing 2,500 tonnes per day from a near-surface, ramp-access underground operation.
All figures are in Canadian Dollars, unless specified otherwise.
Highlights
The project has a $219.4M1 pre-tax NPV8 against a project capital cost of $89.5M. After-tax NPV of $157.5M
The pre-tax internal rate of return (IRR) is 39%, and the after-tax IRR is 32%
At spot pricing1, pre-tax NPV8 totals $316M with pre-tax IRR of 52%
The asset is designed from the ground up as a low-cost, high-margin producer with access to the first seven months from collaring the ramp portal. The project maximizes the use of temporary infrastructure and utilizes toll milling at a nearby facility
The capital payback is 2.5 years from the start of production through healthy operating margins of 45%
Baseline environmental studies are primarily completed to support future permitting of the project
The Project is near the City of Thunder Bay, Canada, where key highway and electrical infrastructure and support are located
The Company has positive relationships and is working closely with nearby Indigenous communities to allow full and meaningful participation in the project
The resource has been updated with additional drilling and new pricing, highlighting a 14.9M tonne indicated resource grading 2.66 g/t 2PGE2, 0.40% Cu and 0.24% Ni
Additionally, there are 2.49M tonnes of inferred resource grading 1.62 g/t 2PGE2, 0.31% Cu and 0.19% Ni. There are no reserves
Notes:
Study pricing and Spot pricing are outlined in Table 7
2 PGE = Platinum + Palladium
Resource table which shows indicated and inferred material is outlined in Table 9
CEO Mike Garbutt P.Eng, MBA stated that "The PEA is a critical step in advancing the Thunder Bay North Project and more importantly, it adds to the list of significant critical mineral opportunities in this province and has the potential to provide long-term economic opportunities for Northwestern Ontario. We intend to move this project forward and continue exploration efforts on the Escape down-plunge through a follow-up to the successful resource expansion hole recently drilled within this area."
The PEA was independently prepared by Mr. Denis Decharte, P. Eng of SLR, Mr. Michael Selby, P. Eng of Technica Mining, Mr. Charlie Buck, P. Eng of XPS and Mrs. Maria Story of Story Environmental, who are considered independent "Qualified Persons" under National Instrument 43-101 Standards of Disclosure for Mineral Projects. The technical disclosure in this news release is based upon the information in the PEA prepared by or under the supervision of Mr. Decharte, Mr. Selby, Mr. Buck, and Mrs. Story. The Company will file the complete PEA report on Sedar+ at www.sedarplus.ca within 45 days of this press release.
Table 1. PEA Summary of Key Project Metrics
Project Metric | Units | Value |
Pre-tax NPV 8% | $ M | 219.4 |
After-tax NPV 8% | $ M | 157.5 |
Pre-tax IRR | % | 39 |
After-tax IRR | % | 32 |
Payback period from production start | years | 2.5 |
Initial CAPEX | $ M | 89.5 |
Sustaining CAPEX | $ M | 162.7 |
Maximum Production Rate | Mtpa | 0.91 |
Mine Life | years | 11 |
Total Mill Feed | ktonnes | 8,705 |
LOM Feed Grade | Pt (g/t) eq1 | 4.92 |
Total Revenue (net of royalties) | $ M | 1,584 |
Total Operating Costs | $ M | 874 |
Pre-Tax Operating Cashflow | $ M | 453 |
Net Smelter Return (NSR) | $ / tonne feed | 189 |
Operating Margin | % | 45 |
Operating Costs | ||
Mine Operating Cost | $ / tonne feed | 66.80 |
Transportation and Toll-Milling | $ / tonne feed | 33.60 |
Total Site Operating | $ / tonne feed | 100.40 |
Royalties | $ / tonne feed | 6.80 |
Note: Values have been rounded
Pt..eq Platinum equivalent are calculated as follows: Pt.eq = (Pt grade/31.1035 x $1425 + Pd grade x 31.1035 x 86.0% x $1,225 + Cu grade x 2204 x 94% x $4.80 + Ni grade x 2204 x 57% x $6.60 + Au grade/31.1035 x 85% x $2,800 + Ag grade/31.1035 x 65% x $30) / $1225
The project cash flows were modelled using a simple discounted cash flow model, with an 8% discount rate. The project cash flow is scheduled annually and uses an exchange rate of 1.37 CAD to USD. Taxes were evaluated for federal and provincial corporate tax rates, as well as the Ontario Mining tax rates, subject to appropriate deductions for CEE, CDE, and depreciation allowances.
Strategic Intent
The Thunder Bay North project contains several critical minerals and therefore is ideally positioned to meet the priority goals of both the Federal and Provincial governments including advancing meaningful economic reconciliation with several Indigenous communities.
The toll milling scenario contemplated in the Thunder Bay North PEA looks to take advantage of the significant processing capability in the region, specifically the Lac-des-Iles (LDI) Mine and Mill situated 65 km north of the Thunder Bay North project. The recent announcement from Impala Canada about the pending closure of the LDI mine presents a potential new opportunity. Clean Air Metals has a significant interest in working through unexplored options to utilize infrastructure at LDI, up to and including the possible acquisition of the assets and continued operation LDI with supplementary higher-grade feed from Thunder Bay North. There can be no certainty that any business arrangement with Impala Canada can be reached for the processing of ores from the Thunder Bay North Project.
Path Forward for the Project
Based on the strong initial economics and the current dynamic metals market, the Board of Clean Air Metals has given management approval to fast-track the project towards a final production decision. The key steps to reaching this milestone are as follows:
Advancing appropriate NI 43-101 studies, engineering, environmental and permitting activities
Continued consultation with local Indigenous communities
Exploring all available processing opportunities
Raising capital to fund the above work
Begin assembling the construction financing plan, including support from the federal and provincial governments as well as the private sector
Clean Air Metals Chair Jim Gallagher, P.Eng. stated: "The Board is quite pleased with the results of the study. The project features high-grade material very close to the surface with minimal infrastructure requirements, given its proximity to Thunder Bay. This results in a low-risk, quick-payback project. Recent drill results demonstrate the continuation of the mineral zones at depth, suggesting the potential for a significantly longer mine life. Given the very strong government support for critical mineral projects and the recent improvement in metal prices, there has never been a better time to move this project forward."
Capital and Operating Costs Summary
The initial project capital cost is estimated at $89.5M, including a 25% contingency allowance for all capital items. The duration of the construction phase of the project is estimated at 24 months. The capital cost estimates are detailed in Table 2. Operating costs average $100.40 per tonne, driven by maximizing stope size and efficient operating development designs for near-surface, underground bulk mining. The operating cost summary is shown in Table 3.
Table 2: Project and Sustaining Capital Cost Estimates
Category | Unit | Initial Project | Sustaining | Total |
Capital Development | $ M | 19.8 | 64.1 | 83.9 |
Underground Infrastructure | $ M | 2.0 | 19.1 | 21.1 |
Mobile Equipment Lease | $ M | 4.8 | 72.0 | 76.8 |
Sample Tower and Pads | $ M | 2.3 | - | 2.3 |
Access Road / Prep / Ditching | $ M | 3.5 | - | 3.5 |
Site Power | $ M | 3.4 | 2.3 | 5.7 |
Ventilation Fans and Heating | $ M | 2.5 | 4.5 | 7.0 |
Other Surface Infrastructure | $ M | 9.8 | 0.7 | 10.5 |
Pre-Production Indirect | $ M | 18.7 | - | 20.8 |
Mine Closure | $ M | 5.0 | 5.0 | |
Engineering and Procurement | $ M | 4.8 | - | 4.8 |
Project Contingency | $ M | 17.9 | - | 17.9 |
Total | $ M | 89.5 | 167.7 | 257.2 |
Note: Values have been rounded
Table 3: Operating Cost Summary
Category | LoM Cost ($M) | Average ($/t prod) | ||
Mine Production | 110.0 | 12.60 | ||
Operating Development | 61.1 | 7.00 | ||
Haulage | 65.7 | 7.50 | ||
Indirect Costs | 280.1 | 32.20 | ||
Transportation and Processing | 292.4 | 33.60 | ||
General and Administration | 64.5 | 7.40 | ||
Total | 874.7 | 100.40 | ||
Note: values have been rounded
Sensitivity
The sensitivity analysis identified that project economics are most sensitive to changes in operating costs and metal pricing. Results are shown in Tables 4 through 6.
Table 4: Cost Sensitivities for Post-Tax NPV8
Variables | ||||
Change | Unit | Initial Capital | Sustaining Capital | Operating Cost |
20% | $ M | 144 | 141 | 77 |
10% | $ M | 151 | 149 | 118 |
5% | $ M | 154 | 153 | 138 |
-0% | $ M | 158 | 158 | 158 |
-5% | $ M | 161 | 162 | 177 |
-10% | $ M | 164 | 166 | 197 |
-20% | $ M | 171 | 174 | 235 |
Note: Values have been rounded
Table 5: Metal Price Sensitivities for Pre-Tax NPV8
Variables | ||
Change | Unit | All Metals |
10% | $ M | 320 |
SPOT | $ M | 316 |
5% | $ M | 270 |
-0% | $ M | 219 |
-5% | $ M | 169 |
-10% | $ M | 118 |
Note: Values have been rounded
Table 6: Metal Payable Sensitivities for Pre-Tax NPV8
Variables | ||||
Change | Unit | Platinum Payable | Palladium Payable | Copper Payable |
10% | $ M | 250 | 251 | 246 |
5% | $ M | 235 | 235 | 233 |
-0% | $ M | 219 | 219 | 219 |
-5% | $ M | 204 | 204 | 206 |
-10% | $ M | 189 | 188 | 193 |
Note: Values have been rounded
Ramp-up of Market Interest in Platinum and Palladium
The Company is also encouraged by recent market dynamics, particularly with platinum and palladium pricing. The fundamentals for platinum, in particular, have been steadily improving, with increased deficits expected to continue for the next 5-10 years. Key market drivers that are fueling this price recovery include:
Despite recent improvements, spot prices for PGEs continue below the marginal cost of supply for many primary PGE operations worldwide and thus are operating at a loss. This is resulting in production curtailments worldwide
A significant volume of the world supply of PGEs originates in Russia and South Africa, which have aging infrastructure that is prone to disruptions, and have been generally heavily undercapitalized during this recent downturn
Supply deficits have existed for 10 of the last 11 years
Future growth in demand for PGEs will be driven in part by slowing battery electric vehicle growth, that is taken up by hybrid and plug-in hybrids that have significant PGE loadings. This is further supported by recent US policy changes regarding EVs
Recycling has not picked up and is plagued by a lack of interest and investment
Platinum is increasingly seen as a lower-cost store of value in the face of rising gold prices
Following nearly four years of a declining outlook for PGEs, the Company believes that the strong results and timing of this study, in conjunction with recent exploration success in the Escape down-plunge, provide a solid platform for the Company to move forward. Table 7 shows the price deck for the study in comparison to the spot price on October 7th, 2025. Table 8 illustrates the potential impact on project metrics resulting from the increased interest in the platinum and palladium markets and associated changes in spot prices.
Table 7: Study Price Deck and Spot Pricing
Metal | Unit | Study Price1 | Spot Price (October 7, 2025) |
Platinum | $ US/oz | 1425 | 1629 |
Palladium | $ US/oz | 1225 | 1323 |
Gold | $ US/oz | 2800 | 3692 |
Silver | $ US/oz | 30 | 48.47 |
Copper | $ US/lb | 4.80 | 5.04 |
Nickel | $ US/lb | 6.60 | 7.02 |
Study prices are based on a combination of recent information from various financial institutions and long-term metal forecasts.
Table 8: Impact of Recent Improvement to PGE Markets
Project Metric | Study Price Deck | Spot (Oct 7, 2025) | |
Pre-tax NPV - 8% | $ M | 219 | 316 |
After-tax NPV 8% | $ M | 158 | 225 |
Pre-tax IRR | % | 39 | 52 |
After-tax IRR | % | 32 | 44 |
Payback period from production start | years | 2.5 | 2.0 |
Operating Margin | % | 45 | 50 |
Note: subject to rounding |
Note on Mineral Reserves, Mineral Resources and PEA
There are no Mineral Reserves for the Thunder Bay North Project currently. The information reported in the PEA for the Project is preliminary in nature. It includes Inferred Mineral Resources that are considered too speculative geologically to have economic considerations applied to them that would enable them to be categorized as Mineral Reserves. Inferred Mineral Resources are based on limited geological evidence and sampling. The tonnage and grade of Inferred Mineral Resources are subject to significant uncertainty regarding their existence and whether they can be mined economically. There is no certainty that the results for the PEA for the Project will be realized.
Updated Mineral Resource
The Updated Mineral Resource Estimate was prepared by SLR Consulting Ltd. ("SLR") and is based on an underground constrained resource model using a Net Smelter Return (NSR) cut-off value of US$46/tonne and consensus metal pricing.
The Current Deposit contains an Indicated Mineral Resource of 8.8 million tonnes grading 2.7 g/t 2PGE ("Pt + Pd"), 0.32% copper and 0.22% nickel and an Inferred Mineral Resource of 1.7 million tonnes grading 1.7 g/tonne 2PGE, 0.32% copper, 0.21% nickel.
The Escape Deposit contains an Indicated Mineral Resource of 6.0 million tonnes grading 2.6 g/t 2PGE, 0.52% copper, 0.28% nickel and an Inferred Mineral Resource of 0.8 million tonnes grading 1.4 g/tonne 2PGE, 0.27% copper, 0.17% nickel.
Summaries of resource grades and contained metals are presented in Tables 9 and 10 below.
Table 9 Thunder Bay North Resource Table
Project | Classification | Density | Tonnage | Average Grade | ||||||
Pt | Pd | Au | Ag | Cu | Ni | 2PGE | ||||
t/m³ | Mt | g/t | g/t | g/t | g/t | % | % | g/t | ||
Current Lake | Indicated | 2.94 | 8.87 | 1.39 | 1.30 | 0.09 | 1.96 | 0.32 | 0.22 | 2.68 |
Inferred | 2.95 | 1.65 | 0.91 | 0.83 | 0.07 | 1.91 | 0.32 | 0.21 | 1.74 | |
Escape Lake | Indicated | 3.11 | 6.03 | 1.17 | 1.45 | 0.11 | 3.30 | 0.52 | 0.28 | 2.62 |
Inferred | 3.01 | 0.83 | 0.63 | 0.75 | 0.05 | 1.61 | 0.27 | 0.17 | 1.37 | |
Total | Indicated | 14.90 | 1.30 | 1.36 | 0.10 | 2.51 | 0.40 | 0.24 | 2.66 | |
Inferred | 2.49 | 0.81 | 0.80 | 0.07 | 1.81 | 0.31 | 0.19 | 1.62 | ||
Table 10 Thunder Bay North Contained Metal Table
Project | Classification | Density | Tonnage | Contained Metal | ||||||
Pt | Pd | Au | Ag | Cu | Ni | 2PGE | ||||
t/m³ | Mt | koz | koz | koz | koz | kt | kt | koz | ||
Current Lake | Indicated | 2.94 | 8.87 | 396 | 370 | 25 | 560 | 29 | 19 | 766 |
Inferred | 2.95 | 1.65 | 48 | 44 | 4 | 102 | 5 | 3 | 93 | |
Escape Lake | Indicated | 3.11 | 6.03 | 226 | 282 | 21 | 640 | 31 | 17 | 508 |
Inferred | 3.01 | 0.83 | 17 | 20 | 1 | 43 | 2 | 1 | 37 | |
Total | Indicated | 14.90 | 622 | 652 | 47 | 1,201 | 60 | 36 | 1,274 | |
Inferred | 2.49 | 65 | 64 | 5 | 144 | 8 | 5 | 129 | ||
Notes:
CIM (2014) definitions were followed for Mineral Resources
Mineral Resources are estimated using a long-term platinum price of US$1,400 per ounce, a palladium price of US$1,200 per ounce, a gold price of US$2,800 per ounce, a silver price of US$38 per ounce, a copper price of US$5,00 per pounds, a nickel price of US$9.50 per pounds, and a US$/C$ exchange rate of 1:1.37
The Mineral Resources have been reported within underground reporting shapes generated using a NSR cut-off value of US$46/t
For Current Lake, the NSR used for reporting is based on the following
Mill recoveries are 81% for platinum, 86% for palladium, 84% for gold, 69% for silver, 94% for copper and 57% for nickel
NSR(US$/t) is calculated as follow: US$30.41/g * grade Pt (g/t) + US$27.87/g * grade Pd (g/t) + US$44.45/g * grade Au (g/t) + US$0.27/g * grade Ag (g/t) + US$79.07/% * grade Cu (%) + US$36.54/% * grade Ni (%)
For Escape Lake, the NSR used for reporting is based on the following
Mill recoveries are 81% for platinum, 86% for palladium, 84% for gold, 69% for silver, 94% for copper and 57% for nickel
NSR(US$/t) is calculated as follow: US$30.41/g * grade Pt (g/t) + US$27.77/g * grade Pd (g/t) + US$41.66/g * grade Au (g/t) + US$0.28/g * grade Ag (g/t) US$82.13/% * grade Cu (%) + US$44.04/% * grade Ni (%)
Bulk densities were interpolated into blocks and averages range from 2.94 t/m³ to 3.11 t/m³
Mineral Resources that are not Mineral Reserves do not have demonstrated economic viability
Numbers may not add due to rounding.
2PGE = Pt + Pd
Mineral Resource Estimate
Block models for the Current and Escape Deposits were created by SLR using Seequent's Leapfrog Geo and Edge using drilling and assays results as of April, 2025. Wireframes for the ultramafic chonolith were generated based on logged lithologies and chromium assays. Higher grade mineralization wireframes were generated at a 1.0 g/t Pt + Pd cut-off grade with lower grades included to maintain continuity. Assays were composited to 2 m lengths and were used for block estimation on an uncapped basis, except for silver for which assays have been capped at 39 g/t before compositing for the Escape Deposit only. Pt, Pd, Au, Ag, Cu, Ni and density were interpolated using Ordinary Kriging (OK) into blocks measuring 5.0 m by 5.0 m by 2.5 m. Inverse Distance Squared (ID2) and nearest neighbour estimates were run for validation purposes. Blocks were classified following CIM Definitions (2014) as Indicated and Inferred using drill hole spacing based criterion. Indicated Mineral Resources were based on a nominal drill hole spacing of 50 m. Mineral Resources have been reported within underground reporting shapes based on an NSR cut-off value of US$46/tonne. A crown pillar exclusion of 20 m from the bottom of the overburden below lakes and the underground reporting shapes used during reporting ensure that the Mineral Resources meet the minimum requirements for Reasonable Prospects of Eventual Economic Extraction (RPEEE).
NSR and Mineral Resources Cut-off Value
NSR values have been estimated for an operating scenario that includes production of a split copper sulphide concentrate and a nickel-rich residual sulphide concentrate, each containing payable platinum and palladium, for both the Escape and Current deposits.
Metal prices are based on consensus, long term forecasts from banks, financial institutions, and other sources. The metal prices and other input parameters used in development of a unit NSR value for each block is provided in Table 11.
Table 11: - NSR Parameters in Resource
Commodity | Units | Metal Prices (US$) | Mill Recovery | Refining Cost (US$) |
Palladium | per oz | $1,200 | 86% | 15.00 |
Platinum | per oz | $1,400 | 81% | 15.00 |
Silver | per oz | $38.00 | 69% | 0.45 |
Gold | per oz | $2,800 | 84% | 4.50 |
Copper | per lb | $5.00 | 94% | 0.07 |
Nickel | per lb | $9.50 | 57% | 0.03 |
Note: Transportation cost used in the resource was US $100/wet tonne,while Treatment costs used were US $70 for Cu concentrate and US $174 for Bulk Concentrate.
For Mineral Resource reporting, underground constraining shapes were developed using Leapfrog Geo based on an NSR cut-off value of US$46/tonne. The cut-off parameters, based on current incremental operating cost estimates, are provided in Table 12.
Table 12. NSR Resource Cut-off Parameters
Cost Parameter | Unit | Value |
Mining (Underground) | C$/t milled | 26.81 |
Processing | C$/t milled | 29.29 |
G&A | C$/t milled | 6.75 |
Total Unit Operating Cost | C$/t milled | 62.85 |
Total Unit Operating Cost US$ | US$/t milled | 45.88 |
NSR US$ cut-off (rounded) | US$/t milled | 46.00 |
Mining and Metallurgy Operating Summary
The study outlines a nominal 0.91 Mtpa (million tonnes per year) mining rate from a ramp-access underground mining operation with over an 11-year mine life, plus two years of construction. Production will be sampled on-site and sent for assays, with ROM production sent to an off-site facility for toll milling.
Early revenue is generated by prioritizing near-surface production within the Lower Current and Bridge Zones, grading 3.2 g/t 2PGE + 0.4%Cu and 0.24% Ni for the first 5 years of production. All LOM production is contained within the indicated resource and does not contain any inferred resource.
Operating costs average $100.40 per tonne mined with an NSR of $189 per tonne over the life, driven by maximizing stope size, efficient operating development design and optimizing use of backfill.
Mine Operations
The proposed Thunder Bay North operation involves underground mining of 2,500 tonnes per day of mill feed and a peak average of 1,000 tonnes per day of development waste.
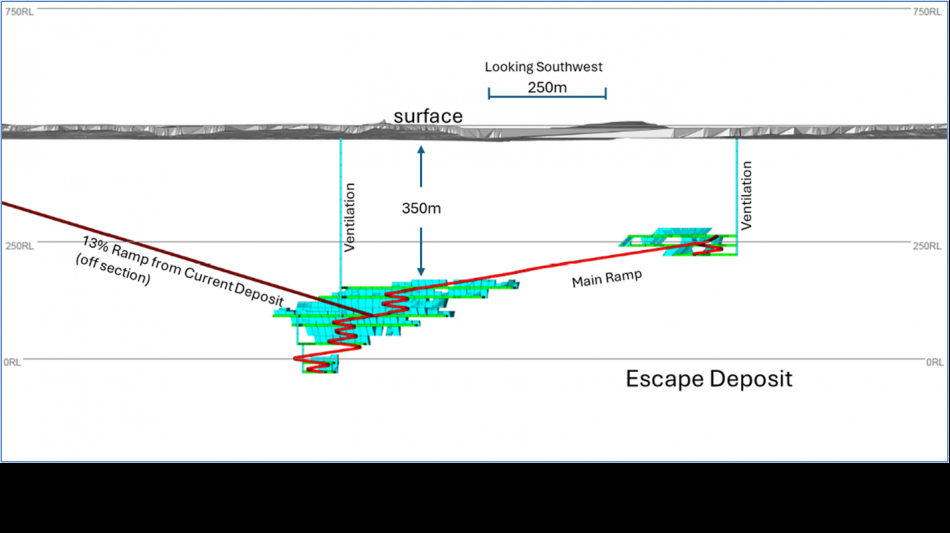
The Current Deposit is accessed via a portal from surface to the Current Deposit. Production ramp-up will take place over a period of 18 months with a nominal annual rate of 0.9 Mtonnes/year of toll-mill feed. The main ramp continues towards the Escape Deposit, where production starts in the Escape high-grade zone in production year 4.
Long sections of the proposed Current Deposit and Escape Deposit are shown below in Figures 1 and 2.
Figure 1: Current Deposit Long Section (Facing South-West)
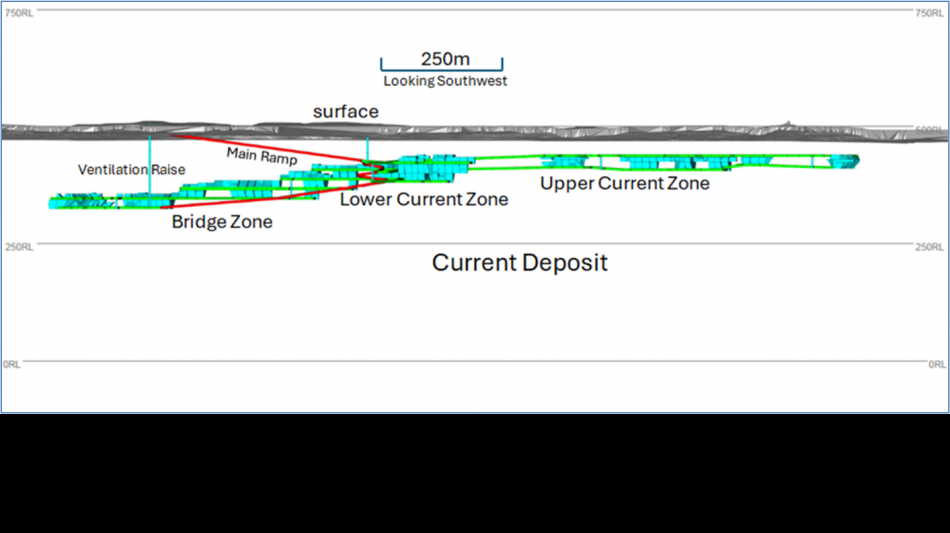
Figure 2: Escape Deposit Long Section (Facing South-West)
The underground mining inventory was determined using Deswik Mineable Shape Optimizer (MSO) software tool. The MSO uses the geological block model to generate shapes (e.g., stopes) based on an initial mining cut-off of $96/tonne, and specifically targeting higher-margin mining zones within the larger resource. The mining underground inventory combines the three mining areas (Current, Bridge, and Beaver-Cloud) within the Current Deposit, and one mining area within the Escape Deposit. The underground stope inventory is constrained by a crown pillar, extending 20 m below the unconsolidated sediments below Current Lake.
The Current and Escape deposits will be mined via conventional underground transverse long-hole open stoping using a combination of cemented rock fill (CRF) and unconsolidated rock fill (URF) where necessary. Early work using the stability graph method outlined the potential to have large, stable stope openings. Stopes are designed to be accessed and excavated via overcut and undercut development cross-cut drifts, which connect to the main declines. The main declines provide ventilation, haulage to surface, and mine access. Table 13 outlines key underground design parameters.
Table 13: Underground Design Parameters
Parameter | Value |
Max Stope Dimensions | |
Length | 45m |
Height | 20 to 40m |
Width | 15 to 30m |
Development Dimensions | |
Width | 5m |
Height | 5m |
Mining Parameters | |
Mining Dilution | 0.5m |
Mining Recovery | 95% |
Mineralogy
Platinum, palladium, and gold mineralization is very fine-grained; however, they are closely associated with all sulphide minerals, including pyrite, pyrrhotite and pentlandite, and recovery of the sulphides will therefore bring along the majority of the precious metal values. Copper is contained primarily as chalcopyrite, and approximately two-thirds of the nickel is in sulphide form, primarily as pentlandite. copper and nickel sulphide material liberation indicates a moderately fine grind is required for good recovery of the sulphides. The remaining nickel is mostly hosted by magnesium-silicate minerals, chiefly serpentine and olivine. Gangue silicates consist of serpentine, pyroxenes, olivine, and feldspar.
Metallurgical Test Work
Two rounds of metallurgical test work have been completed since 2021. The most recent test work developed and evaluated a sequential flowsheet and a bulk concentrate with a separation flowsheet, ultimately choosing the bulk flowsheet for improved PGM recovery. A total of 12 kinetic rougher tests were conducted to optimize the rougher circuit, followed by a total of 36 open-circuit tests to optimize the sequential and bulk separation flowsheets. A comparison of locked-cycle tests revealed that the idealized approach for recovery was to use a bulk concentrate, followed by separation into two concentrates. This program conducted a total of 91 tests including development, variability & locked cycle and other tests as well as extensive mineralogy & comminution measurements.
The successful bulk with separation flowsheet includes grinding to a p80 of 65um in the presence of CuSO4, conditioning with CMC at a pH of 8.5 and bulk flotation using SIPX & 3477 with four stages of cleaning. The bulk cleaner concentrate is reground to a p80 of ~25um at a pH of 11. The regrind product is aerated before flotation in a Cu-Ni rougher with 3477 and 3 stages of cleaning. Results were verified with locked cycle tests and variability testing.
Mineral Processing
The PEA contemplates a regional toll-milling scenario for the Thunder Bay North Project, structured as a future ore sale agreement. No such agreement is currently in place. Run of mine feed would be accumulated into processing lots of an agreed-upon mass at site, sampled via a sampling tower, and transported to the local mining company's concentrator for processing. Consolidated payability terms, which are outlined in Table 14, are based on a combination of projected mill recoveries, assumed smelter terms and minimum deductions, with toll milling fee, treatment charges and refining charges all payable by Clean Air Metals. The Company anticipates the need to undertake additional metallurgical testing, specifically on the toll milling facilities flowsheet, to validate our assumptions and identify optimization opportunities.
Table 14: Estimated Payability Terms Within Toll Milling
Metal | Consolidated Payability |
Platinum | 68% |
Palladium | 77% |
Gold | 40% |
Silver | 21% |
Copper | 84% |
Nickel | 32% |
Key Onsite Project Infrastructure
The project, as contemplated, focuses on minimizing on-site infrastructure. Where possible, site facilities are modular in nature and can be readily removed from the site with minimal cost or effort.
Sample Tower and Ore Pad
The site will have a lined ore pad and sample tower that will be used to sample ROM production from underground. The sample tower crushes ROM ore and splits it to recover appropriately sized samples for assaying. The pad will be designed to accommodate the dumping of underground production and the loading of ROM material for shipment off-site for processing. The ore pad will be reclaimed, and material will be sent underground at closure.
Water Management
Contact water, from the ore pad, as well as water pumped from underground, will be transferred to a 5,000 cubic metre pre-treatment pond. This pond is sized using information from the site's water balance study, and the design can handle climate-normal precipitation, including a 100-year 24-hour rainfall event. All water collected in this pond will be treated by a permitted mobile water treatment plant, with treated water discharged into Escape Lake.
Power
Power is assumed to be supplied via the recently constructed 230 kV E-W tie line, which runs to the south-east of the project site, through the project claims. The project will construct approximately 6 km of new power lines and associated electrical infrastructure to connect to this line.
Access Road
Access to the mine site can be achieved in cooperation with a major forestry company through a combination of upgrades to existing logging roads and the construction of new roads, totalling 10.5 km, which connect to paved Provincial Highway 527 to the West.
Technical Information and Qualified Persons
In addition to the persons listed earlier in this release as "Qualified Persons" for the PEA, the technical information in this release has been reviewed and verified by Dr. Lionnel Djon Ph.D, P.Geo, VP of Exploration for Clean Air Metals and Mr. Mike Garbutt, Peng, President and CEO of Clean Air Metals who are a "Qualified Persons" for the purpose of National Instrument 43-101.
About Clean Air Metals
Clean Air Metals is a development and exploration company advancing its flagship, 100% owned Thunder Bay North Critical Minerals ("TBN") project, 40 km northeast of Thunder Bay, Ontario. The TBN project, accessible by road and next to established infrastructure, hosts two (2) deposits - the Current and Escape deposits, only 2.5 km apart.
One of the rare primary platinum resources outside of South Africa, the TBN project is in a stable and mining-friendly jurisdiction and benefits from longstanding relationships with local First Nations. With its proven technical team, Clean Air Metals is committed to growing the resources at the TBN project and creating long-term value for shareholders.
Social Engagement
Clean Air Metals Inc. acknowledges that the Thunder Bay North Critical Minerals Project is located within the area encompassed by the Robinson-Superior Treaty of 1850 and includes the territories of the Fort William First Nation, Red Rock Indian Band, Biinjitiwabik Zaaging Anishinabek and Kiashke Zaaging Anishinaabek. Clean Air Metals also acknowledges the contributions of the Métis Nation of Ontario, Region 2 and the Red Sky Métis Independent Nation to the rich history of our area.
The Company appreciates the opportunity to work in these territories and remains committed to the recognition and respect of those who have lived, travelled, and gathered on the lands since time immemorial. Clean Air Metals is committed to stewarding Indigenous heritage and remains committed to building, fostering and encouraging a respectful relationship with First Nations, Métis and Inuit peoples based upon principles of mutual trust, respect, reciprocity and collaboration in the spirit of reconciliation.
ON BEHALF OF THE BOARD OF DIRECTORS
"Mike Garbutt"
Mike Garbutt, CEO of Clean Air Metals Inc.
Connect with us on X/ Facebook/ Instagram.
Visit www.cleanairmetals.ca for more information or contact:
Mia Boiridy
Director of Communications and Investor Relations
250-575-3305
[email protected]
Neither TSX Venture Exchange nor its Regulation Services Provider (as that term is defined in policies of the TSX Venture Exchange) accepts responsibility for the adequacy or accuracy of this release.
Cautionary Note
The information contained herein contains "forward-looking statements" within the meaning of applicable securities legislation. Forward-looking statements relate to information that is based on assumptions of management, forecasts of future results, and estimates of amounts not yet determinable. Any statements that express predictions, expectations, beliefs, plans, projections, objectives, assumptions or future events or performance are not statements of historical fact and may be "forward-looking statements." Forward-looking statements are subject to a variety of risks and uncertainties which could cause actual events or results to differ from those reflected in the forward-looking statements, including, without limitation: political and regulatory risks associated with mining and exploration; risks related to the maintenance of stock exchange listings; risks related to environmental regulation and liability; the potential for delays in exploration or development activities or the completion of feasibility studies; the uncertainty of profitability; risks and uncertainties relating to the interpretation of drill results, the geology, grade and continuity of mineral deposits; risks related to the inherent uncertainty of production and cost estimates and the potential for unexpected costs and expenses; results of prefeasibility and feasibility studies, and the possibility that future exploration, development or mining results will not be consistent with the Company's expectations; risks related to commodity price fluctuations; and other risks and uncertainties related to the Company's prospects, properties and business detailed elsewhere in the Company's disclosure record. Should one or more of these risks and uncertainties materialize, or should underlying assumptions prove incorrect, actual results may vary materially from those described in forward-looking statements. Investors are cautioned against attributing undue certainty to forward-looking statements. These forward-looking statements are made as of the date hereof, and the Company does not assume any obligation to update or revise them to reflect new events or circumstances except in accordance with applicable securities laws. Actual events or results could differ materially from the Company's expectations or projections.
SOURCE: Clean Air Metals, Inc.
View the original press release on ACCESS Newswire
(Y.Berger--BBZ)