Berliner Boersenzeitung - A history of $100 crude oil

EUR -
AED 4.191669
AFN 79.696427
ALL 98.136438
AMD 437.041702
ANG 2.042477
AOA 1046.528897
ARS 1355.256036
AUD 1.758723
AWG 2.054256
AZN 1.939744
BAM 1.954128
BBD 2.303984
BDT 139.480623
BGN 1.955312
BHD 0.430275
BIF 3397.692032
BMD 1.141253
BND 1.467661
BOB 7.884732
BRL 6.377095
BSD 1.141103
BTN 97.702546
BWP 15.265992
BYN 3.734284
BYR 22368.563515
BZD 2.292096
CAD 1.562661
CDF 3287.950775
CHF 0.938179
CLF 0.027666
CLP 1061.6504
CNY 8.189617
CNH 8.199511
COP 4686.271119
CRC 581.690019
CUC 1.141253
CUP 30.243211
CVE 110.170709
CZK 24.756045
DJF 203.19692
DKK 7.458798
DOP 67.372338
DZD 150.029471
EGP 56.636525
ERN 17.118799
ETB 155.813109
FJD 2.566964
FKP 0.840269
GBP 0.842553
GEL 3.115747
GGP 0.840269
GHS 11.695735
GIP 0.840269
GMD 80.464812
GNF 9892.533321
GTQ 8.770494
GYD 239.089282
HKD 8.955073
HNL 29.762527
HRK 7.529879
HTG 149.633089
HUF 403.067624
IDR 18608.590589
ILS 3.988601
IMP 0.840269
INR 97.839012
IQD 1495.120378
IRR 48046.761684
ISK 144.15106
JEP 0.840269
JMD 182.273998
JOD 0.809137
JPY 164.603199
KES 147.518173
KGS 99.80256
KHR 4578.199135
KMF 491.311896
KPW 1027.099105
KRW 1551.499821
KWD 0.349943
KYD 0.950903
KZT 582.081816
LAK 24635.166673
LBP 102240.586823
LKR 341.426289
LRD 227.641287
LSL 20.264157
LTL 3.369824
LVL 0.690333
LYD 6.214681
MAD 10.444861
MDL 19.666377
MGA 5147.602038
MKD 61.465967
MMK 2396.083372
MNT 4084.248117
MOP 9.22183
MRU 45.321211
MUR 52.052675
MVR 17.581002
MWK 1978.625142
MXN 21.828939
MYR 4.828078
MZN 72.982992
NAD 20.264157
NGN 1780.491799
NIO 42.00405
NOK 11.522572
NPR 156.354866
NZD 1.893159
OMR 0.438808
PAB 1.141103
PEN 4.137759
PGK 4.690985
PHP 63.635716
PKR 321.901785
PLN 4.287175
PYG 9111.202035
QAR 4.162238
RON 5.044226
RSD 117.120001
RUB 90.557708
RWF 1615.106341
SAR 4.280343
SBD 9.518541
SCR 16.746051
SDG 684.752211
SEK 10.957397
SGD 1.468165
SHP 0.896846
SLE 25.849201
SLL 23931.510072
SOS 652.244624
SRD 42.160192
STD 23621.637899
SVC 9.986453
SYP 14838.379133
SZL 20.257662
THB 37.229392
TJS 11.28097
TMT 4.005799
TND 3.384903
TOP 2.672931
TRY 44.7788
TTD 7.721903
TWD 34.182247
TZS 3001.495577
UAH 47.264048
UGX 4131.445937
USD 1.141253
UYU 47.429407
UZS 14582.519323
VES 112.184195
VND 29734.21193
VUV 137.604744
WST 3.138777
XAF 655.26986
XAG 0.031542
XAU 0.00034
XCD 3.084294
XDR 0.818035
XOF 655.396069
XPF 119.331742
YER 277.675536
ZAR 20.27389
ZMK 10272.643264
ZMW 28.270355
ZWL 367.483078
  • RELX

    -0.1000

    53.67

    -0.19%

  • RYCEF

    0.1050

    11.97

    +0.88%

  • VOD

    -0.0620

    9.895

    -0.63%

  • RBGPF

    0.4600

    67.96

    +0.68%

  • CMSC

    -0.0900

    22.15

    -0.41%

  • BTI

    0.2600

    47.73

    +0.54%

  • GSK

    -0.1300

    41.015

    -0.32%

  • AZN

    0.2500

    72.6

    +0.34%

  • RIO

    -0.3300

    58.9

    -0.56%

  • BCC

    -0.1300

    87.38

    -0.15%

  • CMSD

    0.0000

    22.2

    0%

  • NGG

    -0.0960

    70.904

    -0.14%

  • SCS

    0.0650

    10.44

    +0.62%

  • JRI

    0.0720

    13.042

    +0.55%

  • BCE

    -0.2250

    21.64

    -1.04%

  • BP

    0.1050

    29.17

    +0.36%

A history of $100 crude oil

A history of $100 crude oil

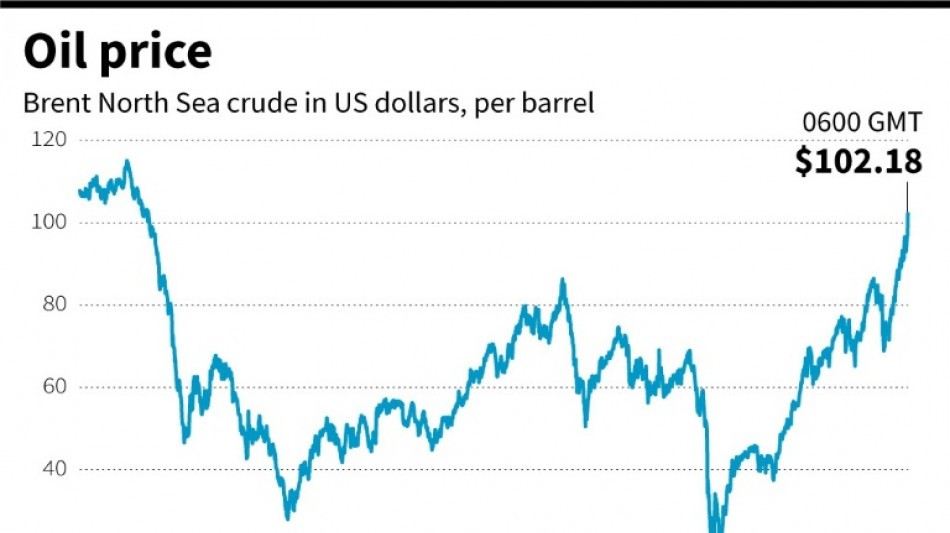
World oil prices on Thursday breached $100 for the first time in more than seven years, this time on supply fears after major producer Russia attacked Ukraine.

Text size:

European benchmark Brent North Sea crude surged more than eight percent to $105.79 per barrel -- the highest level since 2014.

US contract West Texas Intermediate reached $100.54 per barrel, also a peak last seen more than seven years ago.

That capped a meteoric rise over almost two years since crude fell into negative territory for the first time.

In early 2020, oil briefly turned negative following the onset of the coronavirus pandemic that shut offices and factories -- and grounded planes worldwide.

The market tumbled also on scarce storage facilities and a Saudi-Russia price war.

WTI slumped to minus $40.32, meaning that producers paid buyers to take the oil off their hands.

At the same time, Brent tanked to a record low $15.98.

Oil prices have since recovered, rocketing last year to around $70 per barrel as economies reopened from lockdowns, sparking a surge in demand for crude.

Russia is a key member of the expanded OPEC+ producers' grouping that also includes number one player Saudi Arabia.

Here is a timeline of when oil previously topped $100.

- 2012: Iran crude embargo -

Oil started the year above $100 after Western powers imposed a raft of economic sanctions on Iran, including crude exports, aimed at halting its controversial nuclear programme.

- 2011: Arab Spring -

Brent soared to $127 in March 2011 following unrest in the oil-producing Middle East and North Africa region.

The market bounded higher after the so-called Arab Spring uprisings toppled the long-standing leaders of Tunisia, Egypt and Yemen, while unrest also rocked other parts of the region, especially crude producer Libya.

- 2008: Record-high $147 -

On July 11, 2008, Brent hit a record high of $147.50 per barrel, having breached $100 at the start of the year for the first time.

The same day, WTI achieved an all-time peak at $147.27 per barrel.

Crude surged thanks to falling stockpiles in the United States, strong Chinese demand and unrest in key OPEC members Iran and Nigeria.

A weaker dollar also lent strong support, making crude, priced in the currency, cheaper for buyers holding other currencies.

But by December 2008, Brent had tanked to sit at around $36 owing to a severe economic recession worldwide in the wake of the global financial crisis.

burs-em-bcp/rfj/rl

(F.Schuster--BBZ)