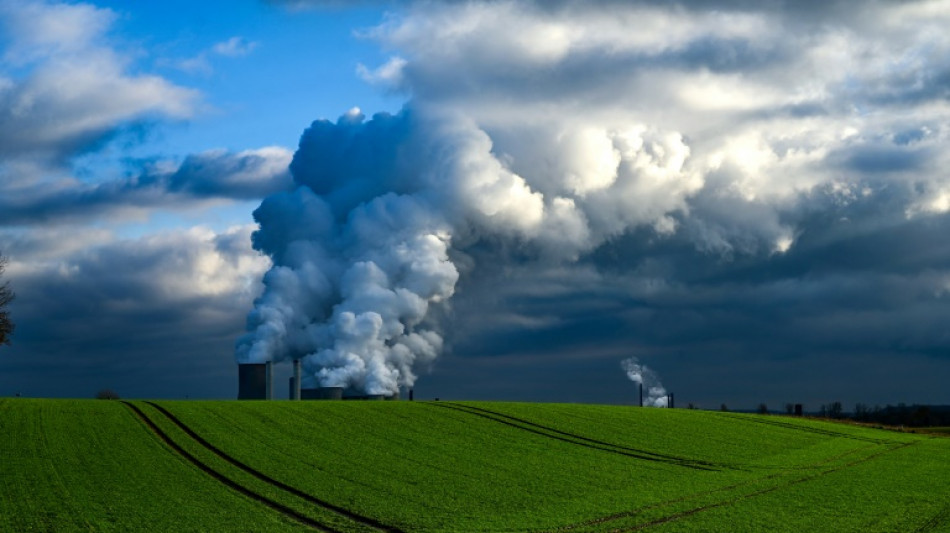
Climate change by numbers / Photo: INA FASSBENDER - AFP/File

As countries try to hammer out a response to climate change at the COP28 talks in Dubai, here are some key figures about how fossil fuels have warmed our world.
- Heat records tumbling -
The decade up to 2020 was easily the hottest on record, with an average global temperature 1.1 degrees Celsius warmer than the pre-industrial era (1850-1900), the World Meteorological Organization (WMO) said in a new report on Tuesday.
The heat melted glaciers and ice sheets at record levels while the seas rose by an average rate of 4.5 millimetres a year, the report said.
The WMO warned last week that 2023 is set to be the hottest year ever recorded, overtaking 2016 and 2020.
This year has been about 1.4C hotter than pre-industrial levels according to data up to the end of October, the UN agency added.
That is worryingly close to the 1.5C threshold for warming under the 2015 Paris agreement -- however that limit is measured over decades.
Under the current emissions-cutting plans, Earth is on track for disastrous heating of between 2.5C and 2.9C by 2100, the UN Environment Programme (UNEP) said last month.
Scientists say data from tree rings and the like suggests the temperatures seen this year could be the warmest in more than 100,000 years.
- How did we get here? -
Emissions of planet-heating carbon dioxide rose by 1.1% last year, climate scientists involved in the Global Carbon Project said Tuesday.
CO2 from burning fossil fuels contributes to around two thirds of all greenhouse gas emissions, according to the UNEP's Emissions Gap report.
The United States and China together accounted for 41 percent of greenhouse gas emissions in 2021, it said.
Looking back, the US was responsible for 19 percent of global warming between 1850 to 2021 -- despite having just four percent of the global population -- followed by 12 percent for China and 10 percent for the EU.
China is expected to increase CO2 emissions by four percent this year, according to the Global Carbon Project.
India's emissions surging by eight percent means it has now overtaken the EU as the third-biggest fossil fuel polluter, it added.
While 775 million people still lack electricity, the richest 10 percent worldwide emit up to 45 percent of all greenhouse gases consumed by households, according to the UN Intergovernmental Panel on Climate Change (IPCC).
- More cuts needed -
When the Paris deal was sealed in 2015, greenhouse gas emissions were projected to rise 16 percent by 2030.
Partly thanks to emissions-cutting efforts, they are now projected to increase by three percent, UNEP said.
However that is nowhere near what is needed, with the IPCC warning that they must be cut by 43 percent by 2030.
Unless more is done, the Global Carbon Project said it is a coin-flip over whether the world will pass the 1.5C limit multiple times by the end of this decade.
- Methane -
Methane is the second largest contributor to global warming after CO2, and is responsible for around 30 percent of the rise in global temperatures since the industrial revolution, according to UNEP.
Around 40 percent of human-driven methane emissions are from agriculture -- which includes gas burped out by livestock such as cows -- while 35 percent are from fossil fuels and 20 percent from solid waste and wastewater.
The UNEP has warned that methane emissions could rise 13 percent over the decade to 2030. However to reach the 1.5 Paris target, they need to fall by up to 60 percent.
- Renewable energy -
Solar, wind and other renewable energies are seen as crucial to achieving net-zero greenhouse gas emissions by 2050.
The International Energy Agency said in September that growth in solar power and electric car sales were in line with a "pathway" needed to reach that goal.
That would require global renewable energy capacity to triple by the end of the decade -- a goal more than 110 nations agreed to at the COP28 talks.
This non-binding commitment could end up in the final negotiated text agreed at the end of the two-week talks.
(L.Kaufmann--BBZ)